Funders. Research Institutions. Research Initiatives.
Simplify research monitoring & evaluation.
Monitor, discover and understand.
Track your organization’s research output in a comprehensive manner. Identify research pathways across key dimensions with granular and timely indicators.
Enhance open science uptake.
Work with the Open Science expert community for open and transparent metrics. Discover Open Science costs and trends for your organization. See how you fare in the European Open Science Cloud.
Turn data into actionable insights.
See what works and what not, reveal hidden potential. Measure research impact, discover trends, connections and collaborations to improve and optimize your future actions.
Tap into the OpenAIRE Graph.
The OpenAIRE Graph is one of the largest open scholarly record collections worldwide, key in fostering Open Science and establishing its practices in the daily research activities. Conceived as a public and transparent good, populated out of data sources trusted by scientists, the Graph aims at bringing discovery, monitoring, and assessment of science back in the hands of the scientific community.
Monitor is built on the OpenAIRE Graph. A global linked research graph, a shared data resource from open initiatives around the world. Our indicators cover a wide range of themes from input to impact.
doneCustomised to your needs
Showcasing, monitoring, analysis
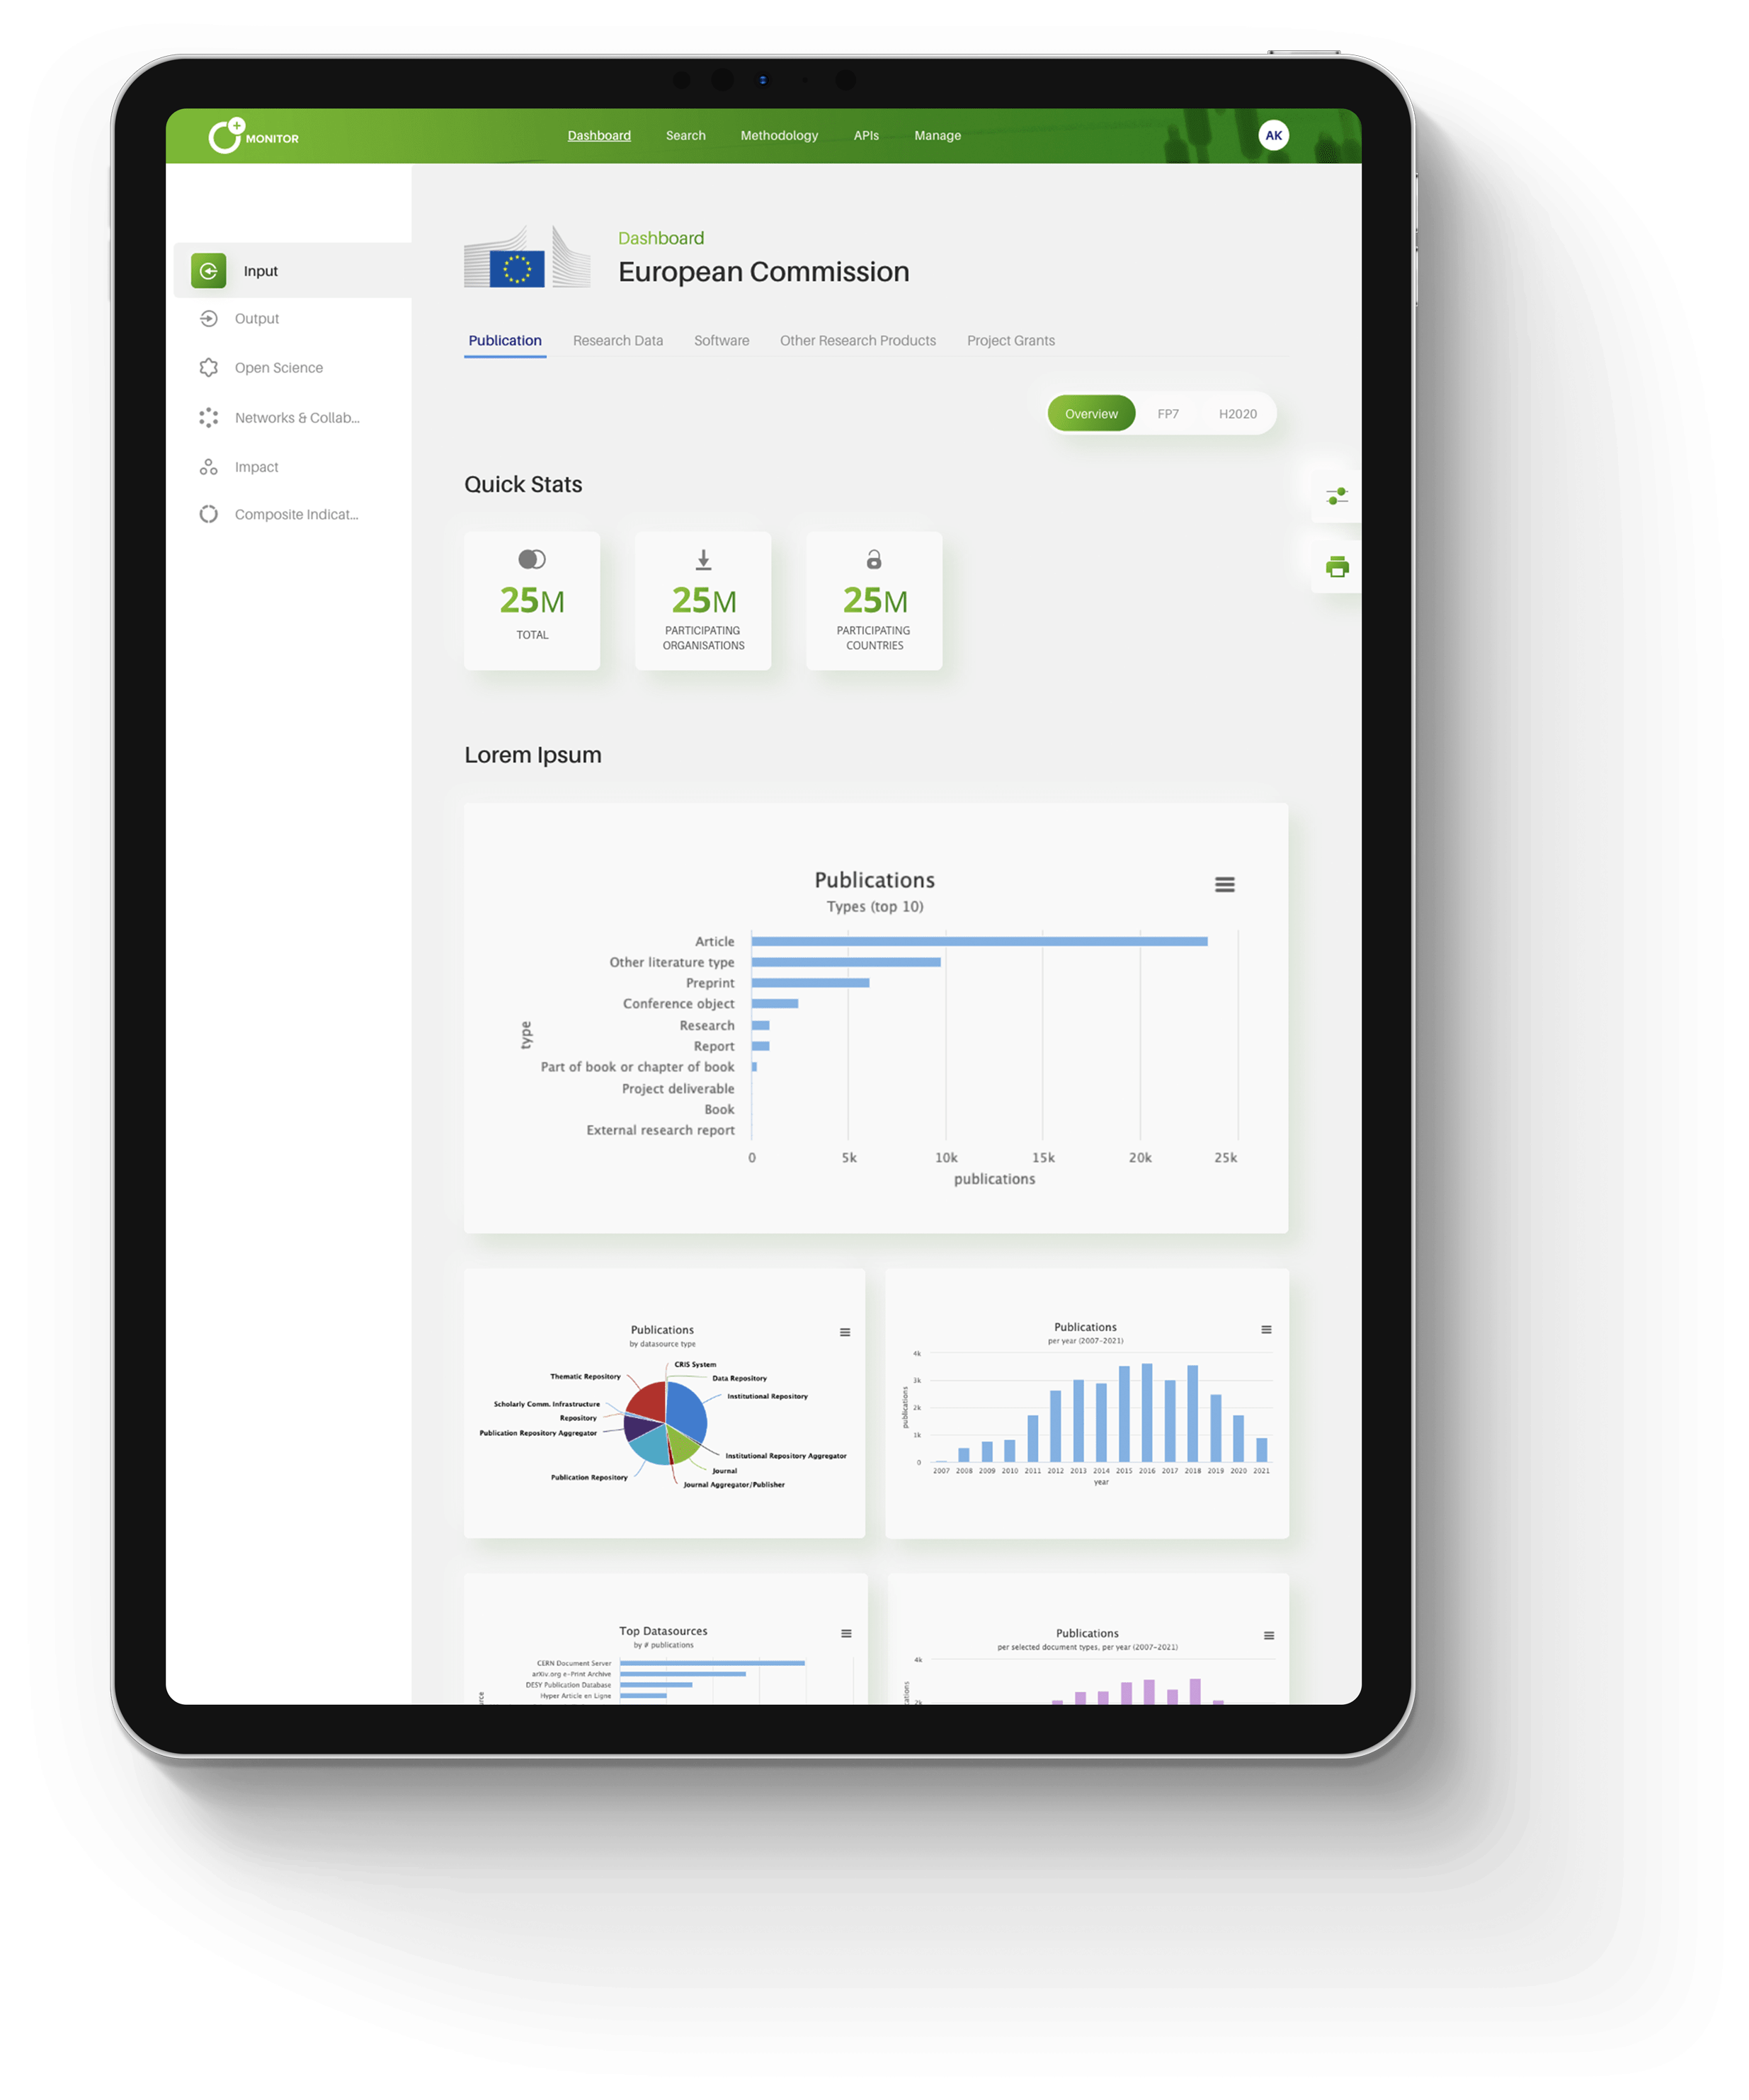
Customize your dashboard by choosing from a variety of pre-defined metrics and select which ones to show publicly, which to invited team members, and which are still work in progress (private).
doneTransparent methodology
Transparent methodology
We base our service on Open Science principles. We rely on open data sources, and document our algorithms for every metric and indicator we publish.
doneMinimum effort to join
Minimum effort to join
You only share some information with us to include in our backend aggregating and data mining, and we deliver a view of your world.
doneCustomised to your needs
Tailor-made monitoring, responsive to your needs
Our experts work with you on demand in one-on-one sessions to provide additional indicators and curate your data.
Dashboards in action.
View existing dashboards from collaborating organizations. Get a preview on how they work and how our service can be customized to serve you.
Funders. Research Institutions. Research Initiatives.
Simplify research monitoring & evaluation.
Monitor, discover and understand.
Track your organization’s research output in a comprehensive manner. Identify research pathways across key dimensions with granular and timely indicators.
Enhance open science uptake.
Work with the Open Science expert community for open and transparent metrics. Discover Open Science costs and trends for your organization. See how you fare in the European Open Science Cloud.
Turn data into actionable insights.
See what works and what not, reveal hidden potential. Measure research impact, discover trends, connections and collaborations to improve and optimize your future actions.
Tap into the OpenAIRE Research Graph.
The OpenAIRE Graph is one of the largest open scholarly record collections worldwide, key in fostering Open Science and establishing its practices in the daily research activities. Conceived as a public and transparent good, populated out of data sources trusted by scientists, the Graph aims at bringing discovery, monitoring, and assessment of science back in the hands of the scientific community.
Monitor is built on the OpenAIRE Graph. A global linked research graph, a shared data resource from open initiatives around the world. Our indicators cover a wide range of themes from input to impact.
doneCustomised to your needs
Showcasing, monitoring, analysis
Customize your dashboard by choosing from a variety of pre-defined metrics and select which ones to show publicly, which to invited team members, and which are still work in progress (private).
doneTransparent methodology
Transparent methodology
We base our service on Open Science principles. We rely on open data sources, and document our algorithms for every metric and indicator we publish.
doneMinimum effort to join
Minimum effort to join
You only share some information with us to include in our backend aggregating and data mining, and we deliver a view of your world.
doneCustomised to your needs
Tailor-made monitoring, responsive to your needs
Our experts work with you on demand in one-on-one sessions to provide additional indicators and curate your data.
Dashboards in action.
View existing dashboards from collaborating organizations. Get a preview on how they work and how our service can be customized to serve you.
OpenAIRE uses cookies in order to function properly. Cookies are small pieces of data that websites store in your browser to allow us to give you the best browsing experience possible. By using the OpenAIRE portal you accept our use of cookies. Read more